HR Metrics
Employee Turnover Rate Formula: Master HR Calculations

Understanding the Employee Turnover Rate Formula

Calculating your employee turnover rate is essential for any HR professional in the UK. This vital metric provides insights into workforce stability and helps identify potential issues. It's a key performance indicator (KPI) that can significantly enhance your HR strategies. This section will guide you in understanding and effectively applying the formula.
Listen to the podcast Here:
Understanding the Formula
The standard employee turnover rate formula is straightforward: (Number of Employees Leaving During the Period / Average Number of Employees During the Period) × 100. This calculation provides a percentage that indicates the proportion of your workforce that departed during a specific period.
For example, if 10 employees left a company with an average of 200 employees over a year, the turnover rate is 5%.
Breaking Down the Components
Grasping each component of the formula is crucial for accurate calculations. The table titled "UK Employee Turnover Rate Formula Components" offers a detailed breakdown of each element for precise turnover calculations.
To ensure accuracy, let's clarify the elements of the formula. The following table details each component for a better understanding:
| Component | Definition | Example |
|---|---|---|
| Number of Employees Leaving | Total employees who left the company during the specified period. | 15 employees left in the last quarter. |
| Average Number of Employees | The average number of employees over the period. | Average workforce was 250 over the quarter. |
This breakdown helps ensure you use the correct figures in your calculations. Accurate data is essential for drawing meaningful conclusions from your turnover rate.
Interpreting the Results
Calculating the employee turnover rate is only the first step. Understanding its significance is equally important. UK employee turnover has varied significantly in recent years. The annual rate reached 19.6% in 2022, then decreased to 16.0% in 2024.
You can find more detailed statistics here: Learn more about UK turnover rates. This data enables you to compare your company's performance against national averages and identify potential areas for improvement.
Comparing your rates to sector-specific benchmarks, such as the hospitality sector's 82% turnover in 2022, provides valuable context. High turnover can indicate issues like poor management, limited career development, or inadequate compensation. Conversely, extremely low turnover might signal a lack of growth opportunities or limited new talent acquisition.
Understanding the employee turnover rate formula and its interpretation provides valuable data to inform your HR strategies. By understanding the formula's components and placing the results in context, you can make data-driven decisions to boost retention and contribute to your organisation's success. This knowledge helps create a more stable and engaged workforce.
Reading The UK Workforce Landscape Shifts
The UK employment market is constantly changing, and understanding these shifts is vital for effective workforce planning. This involves more than just calculating your employee turnover rate. It requires a deep dive into the underlying trends shaping the UK workforce. By analysing recent data and behavioural studies, we gain valuable insights into why UK turnover intentions are often higher than in other developed nations. This knowledge allows HR teams to transition from reactive responses to proactive strategies.
Decoding UK Turnover Trends
A key part of understanding the UK workforce landscape is recognising the connection between employee intentions and actual turnover patterns. Recent surveys and analyses predict a concerning rise in UK attrition rates. According to Culture Amp, an employee experience provider, nearly one in four workers (23%) in the UK plan to leave their jobs soon—a 3% increase compared to 2023. More detailed statistics can be found here. This number is higher than in the US (19%) and Australia (18%), highlighting the unpredictable nature of the UK labour market.
Applying the employee turnover rate formula to these projections suggests that almost a quarter of the workforce could depart within a year. Furthermore, 13% of UK employees don't foresee a long-term future with their current employer. Benchmarking these intentions against actual departures using the employee turnover rate formula enables HR professionals to predict and mitigate potential impacts.
The Financial Impact of Turnover
Replacing an employee can be costly, ranging from 30% to 200% of their salary. With the UK average salary at £37,400 in 2024, this translates to £11,200 to £74,900 per departing employee. This underscores the importance of turnover calculations in financial planning and resource allocation. For more ideas on attracting talent, check out this article: Top Recruitment Marketing Ideas To Attract Talent.
Early Warning Signs and Proactive Planning
Spotting early warning signs of potential turnover is essential for proactive workforce management. These signs could include reduced employee engagement, higher absenteeism, or negative feedback in surveys. Using the employee turnover rate formula alongside sentiment data helps HR anticipate and address potential departures proactively. This shifts reactive "firefighting" to proactive workforce planning, allowing organisations to retain valuable employees and maintain stability.
This move toward proactive planning helps businesses anticipate potential skill gaps and implement targeted recruitment strategies, reducing the negative impacts of high turnover.
How Company Size Shapes Your Turnover Reality
Company size significantly impacts employee turnover dynamics in the UK. Applying the same employee turnover rate formula to a small business versus a large corporation will reveal very different trends. Therefore, relying on generic benchmarks can misdirect your retention efforts.
Turnover Drivers: Small vs. Medium vs. Large
Smaller companies (1–249 employees) often grapple with higher turnover. This is commonly due to limited career progression opportunities and tighter resource constraints. Even a single departure can disrupt team dynamics. Mid-sized organisations (250–999 employees) tend to experience more stability. However, they can be more susceptible to market fluctuations and competitive pressures. Larger firms (1000+ employees) often benefit from well-established HR practices. However, maintaining agility and strong employee connections can be an ongoing challenge.
The infographic below visualises the key drivers of employee turnover, illustrating the various factors that contribute to employees leaving their roles:
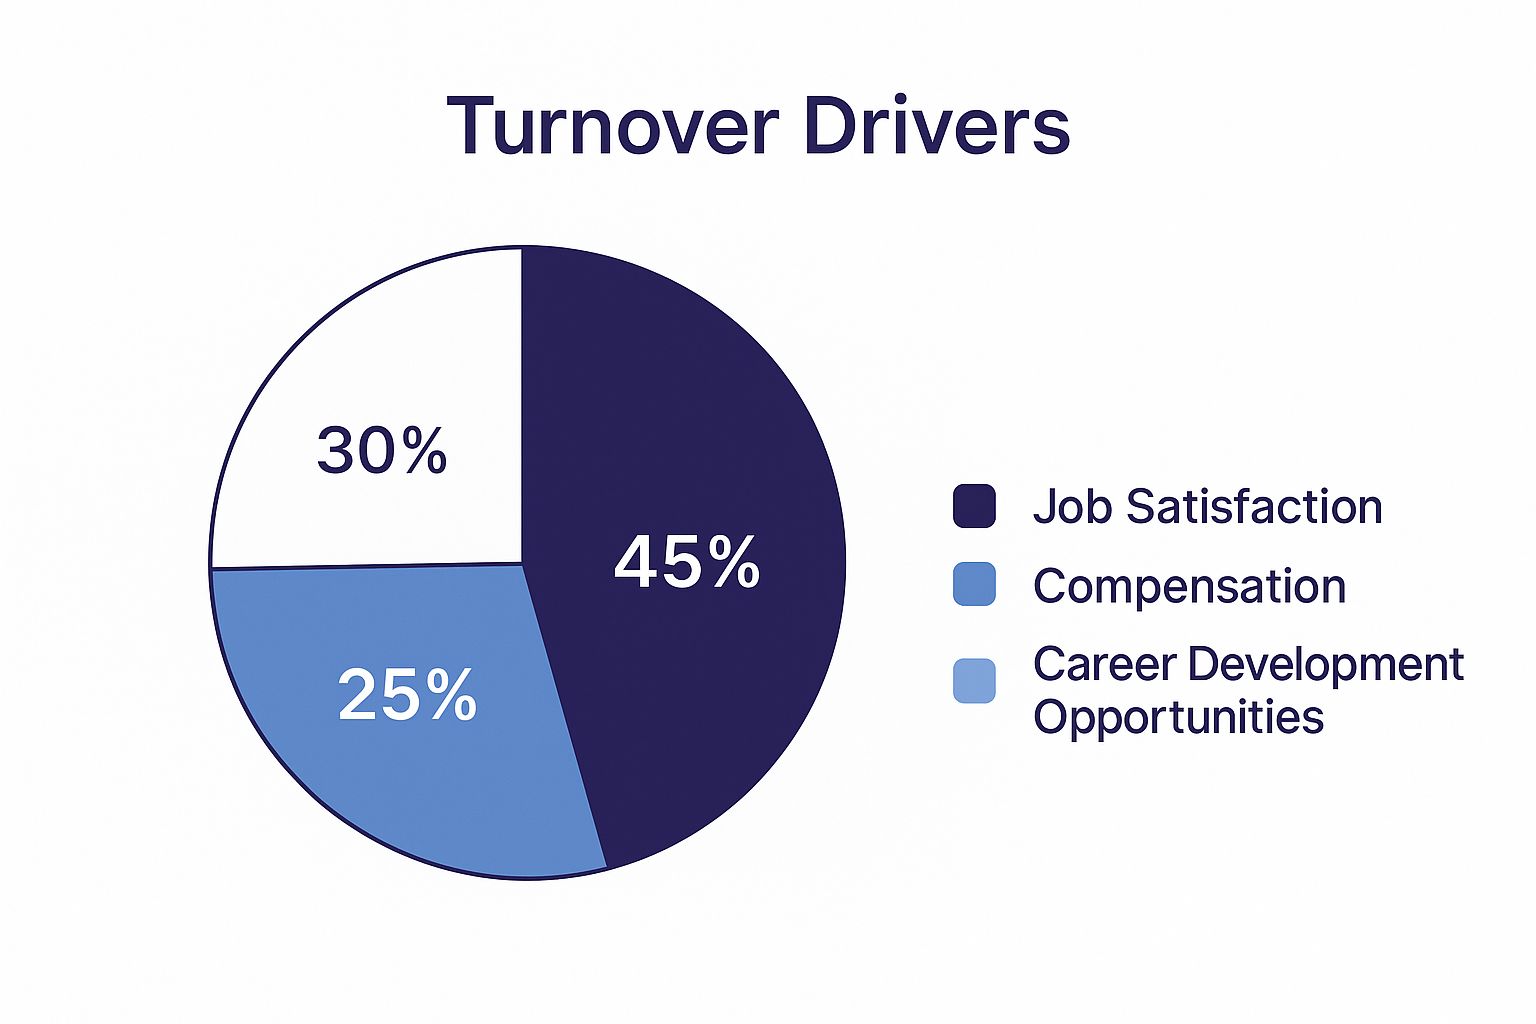
As the infographic shows, job satisfaction is the primary driver, followed by compensation and career development opportunities. Regardless of company size, addressing these core areas is crucial for any effective retention strategy. For more insights on attracting and retaining top talent, check out this resource: How to Create a Strong Employer Brand and Attract Better Talent.
Setting Realistic Benchmarks
Organisation size significantly influences turnover rates in the UK. Data indicates that smaller companies report an average turnover rate of 18.2%, while mid-sized organisations experience a slightly lower rate of 15.4%. Larger firms often manage turnover more effectively through established procedures, although detailed figures for this category are less readily available. The employee turnover rate formula, however, remains consistent across all company sizes, emphasising its universal application as a key HR metric.
To illustrate the scale of the challenge, over 320,000 people resigned from their jobs in the UK during Q1 of 2023. This highlights the critical need for businesses to actively track their turnover rates. Doing so contributes to workforce stability and helps reduce recruitment costs. Find more detailed statistics here.
The following table provides a comparison of average turnover rates and key challenges across different organisation sizes in the UK:
UK Turnover Rates by Company Size
Comparison of average turnover rates across different organisation sizes in the UK
| Company Size | Employee Count | Average Turnover Rate | Key Challenges |
|---|---|---|---|
| Small | 1-249 | 18.2% | Limited career progression, resource constraints, impact of single departures |
| Medium | 250-999 | 15.4% | Market fluctuations, competitive pressures |
| Large | 1000+ | Data less transparent | Maintaining agility, employee connection |
This table highlights the distinct challenges faced by companies of different sizes. While smaller companies struggle with resource limitations and the impact of individual departures, larger organisations grapple with maintaining flexibility and fostering meaningful connections with their employees.
This data underscores the importance of aligning retention strategies with the specific challenges and opportunities presented by different company sizes.
Advanced Analysis Beyond Basic Calculations

While the basic employee turnover rate formula offers a helpful overview, true workforce insights come from more in-depth analysis. This means looking beyond the simple percentages to discover hidden patterns in your data.
Segmentation for Deeper Insights
In-depth segmentation is crucial for unlocking the full potential of your turnover data. Instead of seeing turnover as a single, large number, consider segmenting by department, role, tenure, and even performance levels.
For example, is turnover noticeably higher in your sales team than in marketing? Are junior employees leaving more often than senior staff? This detailed perspective reveals trends that basic calculations miss.
This granular approach allows you to focus on specific areas that need attention, rather than applying a general retention strategy across the board.
Advanced Analytical Techniques
Leading UK organisations are changing their approach to turnover with advanced analytical techniques. Cohort analysis, for instance, lets you track the retention of specific employee groups over time.
This could include everyone hired during a specific quarter or those enrolled in a particular training programme. By analysing how these cohorts perform, you gain valuable long-term insights into your retention strategies.
Seasonal adjustments are also vital. Many industries experience predictable turnover fluctuations throughout the year. Accounting for these seasonal variations helps identify underlying trends and avoid misinterpreting short-term changes.
Finally, predictive modelling can help pinpoint at-risk employees months before they resign. Analysing factors like performance reviews, salary changes, and internal mobility patterns allows you to build models that predict the likelihood of someone leaving. This foresight allows for proactive interventions and focused retention efforts.
Practical Applications for Enhanced Analysis
These advanced techniques aren't just theoretical; they translate into practical actions with real impact. Calculating voluntary versus involuntary turnover rates, for example, offers important information about the nature of employee departures.
High voluntary turnover might indicate issues with company culture or compensation. High involuntary turnover, on the other hand, could point to problems with performance management.
Tracking rolling averages for trend analysis smooths out short-term fluctuations and offers a clearer view of long-term patterns. This allows you to see whether your retention efforts are truly having a sustained, positive effect.
Building early warning systems based on your analysis is vital for proactive workforce management. These systems can alert HR and managers to potential problems before they escalate, providing time to intervene and retain valuable employees.
By incorporating these advanced analytical techniques and practical applications, you can transform your turnover data from simple reporting into powerful strategic workforce intelligence. This shift facilitates proactive interventions, data-driven decisions, and ultimately, a more engaged and stable workforce.
Building Turnover Tracking Systems That Actually Work

Calculating your employee turnover rate is only the first step. UK businesses need reliable tracking systems that go beyond just numbers. These systems should transform raw data into useful insights to truly understand and address turnover. This means leaving behind basic spreadsheets and adopting systems that can adapt and grow alongside your organisation.
Choosing the Right System for Your Needs
The best tracking system for your business depends on several factors. These include company size, budget, and the overall complexity of your workforce. For smaller organisations, a well-organised spreadsheet might be a suitable starting point. This allows for basic tracking of employees who join and leave the company, making it easier to apply the employee turnover rate formula.
However, as your organisation expands, a dedicated HR analytics platform becomes crucial. These platforms offer automation, advanced reporting, and the ability to segment data for more detailed analysis. For example, understanding candidate feedback can be crucial. You can learn more about this in The Importance of Candidate Feedback. These platforms simplify the turnover rate calculation process, allowing HR professionals to focus on strategic initiatives. The shift from manual calculations to automated analysis leads to more efficient and accurate tracking.
Designing Effective Data Collection Processes
No matter which system you choose, collecting data effectively is essential. This begins with clear definitions. What exactly defines an employee as a "leaver"? Does this term include internal transfers, or only employees who leave the company altogether? Consistency is key. Everyone involved in data collection needs to understand the definitions and procedures. This ensures data integrity and prevents discrepancies.
Also, simplify the data collection process for your team. Complicated or time-consuming procedures can introduce errors and result in incomplete data. Simple, streamlined processes encourage regular data entry and improve overall accuracy. This, in turn, ensures the reliability of your employee turnover rate calculations.
Reporting and Analysis: Turning Data into Action
Effective reporting involves more than just presenting the numbers. It's about providing context and valuable insights that drive action. Set up regular reporting schedules—monthly, quarterly, or annually—that align with your business goals.
Go beyond just tracking overall turnover. Segment your data to analyse turnover by department, job role, employee tenure, and other relevant factors. This approach can reveal hidden trends and identify specific areas that require attention. For instance, a consistently higher turnover rate in one department could indicate a problem that needs further investigation.
Automating and Benchmarking for Continuous Improvement
Automate routine calculations and reporting whenever possible. This reduces manual work and minimises errors. Many HR platforms offer automated employee turnover rate formula calculations. This frees up your team for more in-depth analysis.
Establish benchmarks that are relevant to your business. Compare your turnover rates against industry averages and your competitors' rates. This adds context and helps you understand your organisation's performance relative to others.
Finally, create dashboards that visualise your turnover data in a clear and engaging manner. This makes the insights easy to understand and accessible for leadership, encouraging them to take action based on the data. UK organisations can use these strategies to transform their turnover tracking from simple record-keeping into a powerful tool for improving employee retention. Accurate and readily available data empowers HR teams to make well-informed decisions, implement targeted interventions, and cultivate a more stable and engaged workforce.
Transforming Data Into Retention Success
Calculating your employee turnover rate is the first step. But successful UK organisations don't stop there. They transform that data into powerful retention strategies. This is the real power: turning numbers into actionable insights to improve your workforce.
Identifying the Real Drivers of Turnover
Knowing your overall turnover rate isn't enough. You need to understand why employees leave. This means going beyond the employee turnover rate formula and digging deeper. For more insights, check out our guide on 7 Proven Ways to Reduce Employee Turnover in the UK.
Surveys: Use regular employee surveys to measure satisfaction, identify pain points, and uncover potential issues before they lead to resignations.
Exit Interviews: Conversations with departing employees can offer valuable feedback about their experiences and reasons for leaving.
Line Manager Feedback: Include your line managers. They often have direct insight into team morale and individual employee concerns.
By combining information from multiple sources, you develop a clearer picture of the real reasons behind your turnover.
Prioritising Your Retention Strategies
Once you know why employees leave, you can focus on interventions that will have the greatest impact. This means evaluating different strategies and selecting the ones most likely to make a difference.
For example, if exit interviews repeatedly mention a lack of career development, investing in training platforms and mentorship programmes might be a high-impact solution. If compensation is the primary concern, addressing salary competitiveness becomes crucial.
Consider the feasibility of each intervention. Some may require significant investment or organisational changes, while others are easier to implement. Prioritising based on impact and feasibility ensures efficient use of resources.
Measuring the Success of Retention Efforts
Measuring the success of your retention initiatives is just as important as calculating your initial employee turnover rate. Establish clear metrics and track progress.
Turnover Rate Changes: Monitor how your overall turnover rate responds to new strategies. This directly measures the effectiveness of your efforts.
Employee Satisfaction Scores: Track employee satisfaction through surveys and feedback. Increased satisfaction often correlates with improved retention.
Retention of Key Employees: Focus on retaining high-performing or critical employees, as their departure can significantly impact your organisation.
By regularly evaluating the effectiveness of your efforts, you can refine your strategies, allocate resources strategically, and ensure progress toward a more stable and engaged workforce. This continuous evaluation creates a cycle of improvement. Retention is an ongoing process of learning and adapting, not a one-time solution.
Key Takeaways For Turnover Management Success
Effectively managing employee turnover in the UK requires a deep understanding of the employee turnover rate formula and a strategic approach to retention. This section provides actionable takeaways to build a stable and engaged workforce, summarising key calculation techniques, benchmarking strategies, and practical insights.
Mastering the Formula and Its Implications
Accurate calculation is crucial. The standard formula (Number of Employees Leaving During the Period / Average Number of Employees During the Period) × 100 provides a fundamental understanding of turnover. Accurate data input is paramount.
Ensure consistent definitions for "leavers" and meticulous record-keeping to avoid skewed results. This will give you a reliable foundation for your turnover analysis.
Contextual interpretation matters. While national averages offer a general benchmark, comparing your rate to sector-specific data provides more relevant insights. For example, a 5% turnover rate might be high for a finance company but low for a hospitality business.
This comparison helps calibrate your understanding of what constitutes a "good" or "bad" rate for your specific situation. It allows you to benchmark your performance against relevant competitors.
Go beyond the basics. The formula is a starting point. Advanced analysis through segmentation (by department, role, tenure) reveals deeper trends. For instance, if your sales team has a significantly higher turnover than marketing, targeted interventions become possible.
This granular approach allows you to pinpoint specific areas needing attention and develop tailored solutions.
Building Robust Tracking Systems
Choose the right tools. Select a tracking system that aligns with your organisation's size and complexity. While spreadsheets suffice for smaller companies, growing businesses benefit from dedicated HR analytics platforms for automated calculations and deeper analysis.
This ensures that tracking the employee turnover rate becomes a streamlined and accurate process. Choosing the right tools is essential for efficient data management.
Streamline data collection. Establish clear processes for data collection to maintain consistency. Define "leaver" status precisely (e.g., including or excluding internal transfers).
Simplified procedures encourage accurate data entry and reduce errors, leading to more reliable insights. Consistent data collection is the foundation of accurate turnover analysis.
Actionable reporting is key. Regular reporting (monthly, quarterly) provides crucial insights. Visual dashboards make the data readily accessible for leadership, enabling faster responses to emerging turnover trends.
This allows for proactive intervention and more effective management of employee retention.
Turning Insights into Action
Uncover root causes. Don't just measure turnover; understand why it happens. Utilise exit interviews, employee surveys, and line manager feedback to uncover drivers such as inadequate compensation, limited career development, or management issues. You might be interested in: How to Create an Outstanding Candidate Experience.
These insights allow you to address the underlying problems rather than just treating symptoms. Understanding the "why" behind turnover is critical for developing effective solutions.
Targeted interventions are essential. Prioritise retention strategies based on both impact and feasibility. If career development is a key driver, invest in relevant training programmes. If compensation is a major concern, conduct a salary review.
Focusing on the most impactful and feasible solutions ensures that your efforts are directed where they will make the most difference.
Measure retention success. Monitor the impact of your efforts. Track changes in the employee turnover rate, employee satisfaction scores, and the retention of key talent.
Regularly evaluating your strategies allows for continuous improvement and ensures that resources are used effectively. Tracking your progress allows you to refine your approach and optimise your retention efforts.
Building a Sustainable Retention Strategy
Long-term vision is essential. Retention is not a one-off project but an ongoing process. Building a sustainable retention strategy requires a long-term vision and commitment to creating a positive work environment.
This long-term perspective is essential for creating a culture that values and supports employees.
Define your employee value proposition. Define what makes your organisation a great place to work. Communicate this value proposition effectively to both current and potential employees to attract and retain top talent.
A strong value proposition is crucial for attracting and retaining the best employees.
Continuous improvement is key. The UK workforce landscape is constantly evolving. Stay informed about market trends and best practices to adapt your retention strategies and build a resilient, engaged workforce.
Staying ahead of the curve allows you to proactively address emerging challenges and maintain a competitive edge in attracting and retaining talent.